Day 31 - Handmaid's Tale story revelation at 55%; GC Score visualization prototype
20 Mar 2017 100daysofwriting · books · prototype · writingAh, finally! FINALLY! 55% into the book, Margaret Atwood thought it appropriate to reveal the circumstances that lead to the world that Offred and Ofglen and Of* live in. It was terrifying! I think I can now see where the comparison to 1984 comes from. I can’t really talk about it here without marking it as a spoiler for everyone who plans to read this book, so I would much rather talk about it once I have read the whole book and this particular event has more context around it. That said, this is a great book, I can make that judgement on the basis of whatever I have read till now. It has been amazing! Sure, the author took a lot of time to get to the backstory, but the story that she did spend her time on was also interesting and worth reading.
Personally, I like books that keep the readers on their toes all the time by changing the setting, going into long monologues that compare a small feature of the present situation from something in the character’s backstory, essentially introducing the backstory and at the same time showing the readers what the character is thinking about, and what her mindset is. These books are pretty challenging and fun to read.
The next thing that I worked on today was the GC Visualization prototype. The status quo looks something like this:

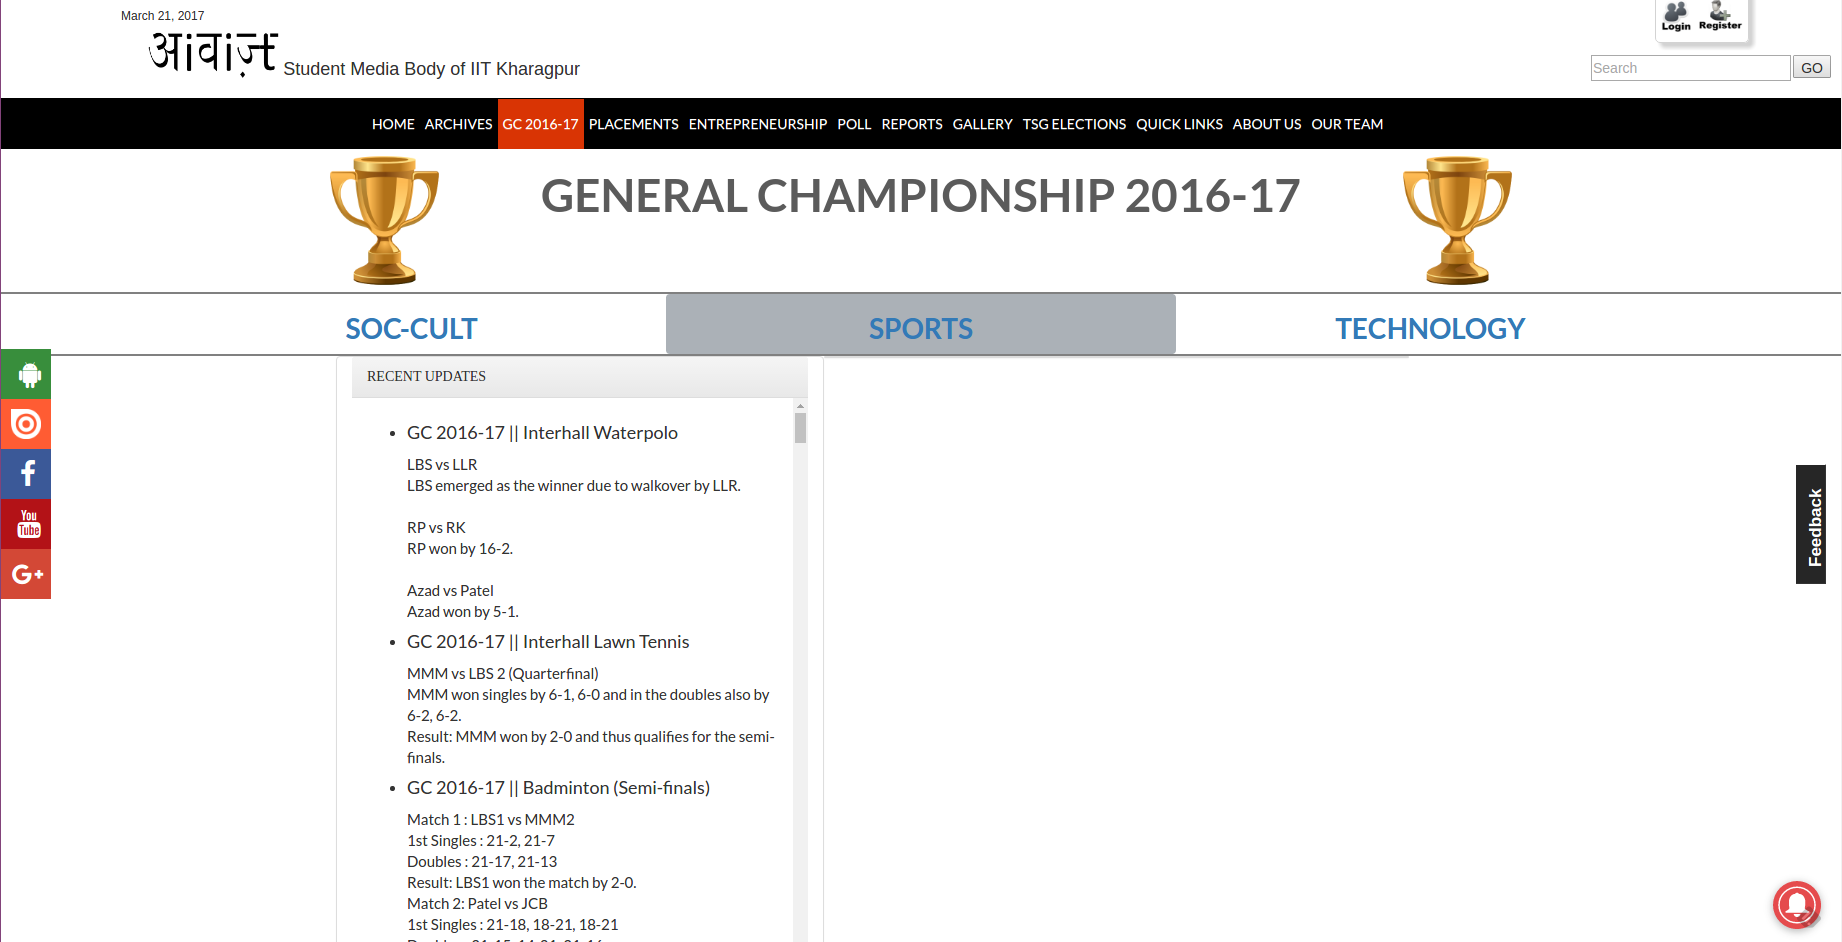
The white space on the right side of the webpage in the above screenshot is where the stacked bar graph should have been.
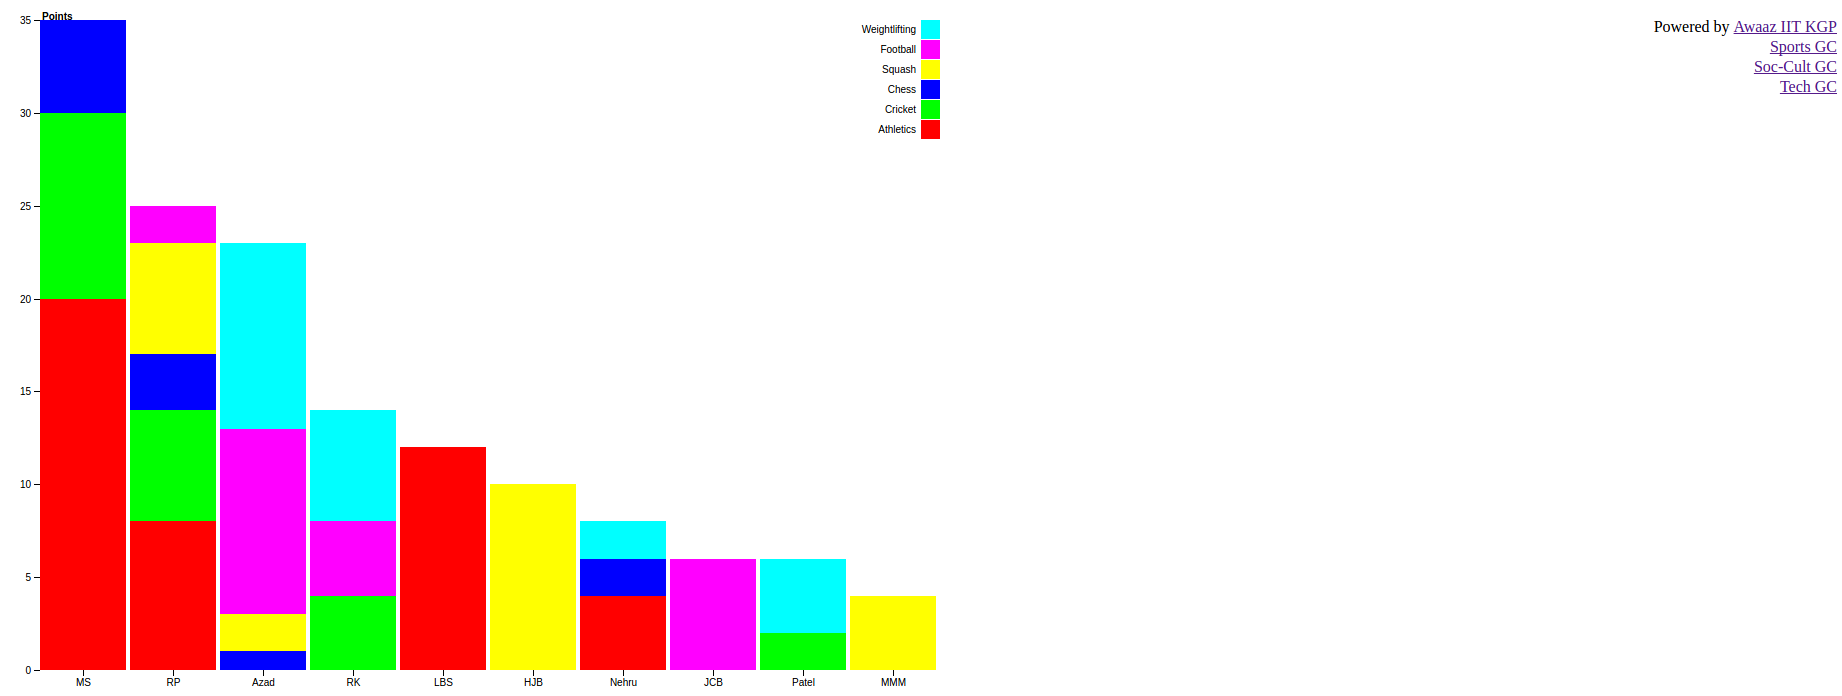
The prototype that I built looks like this:
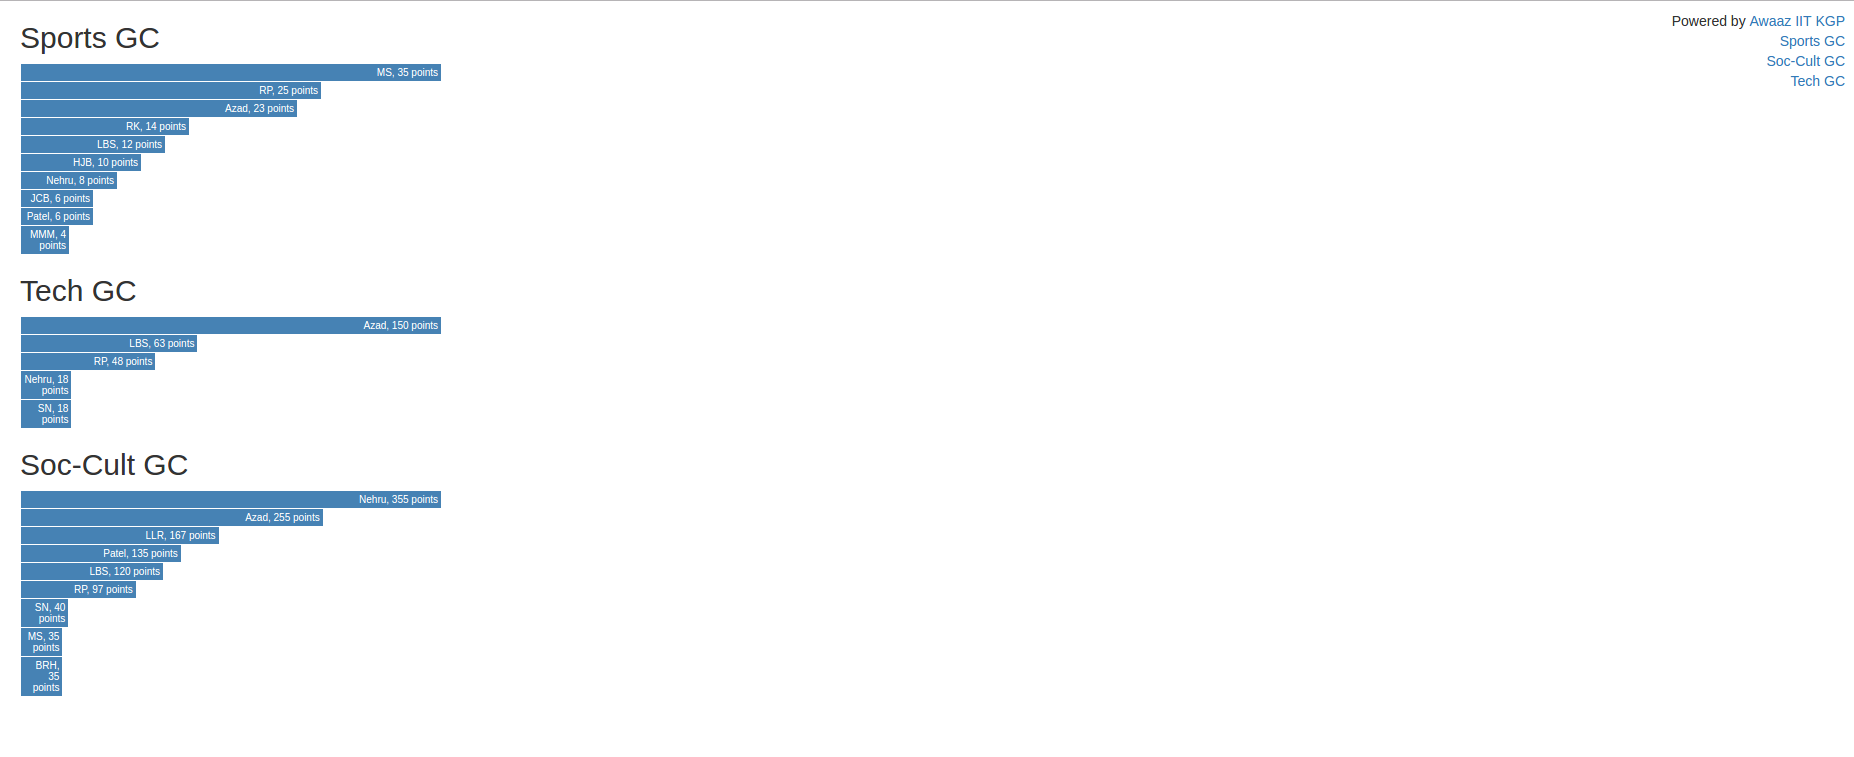
There are some major improvements over the previous page. One word: SPEED
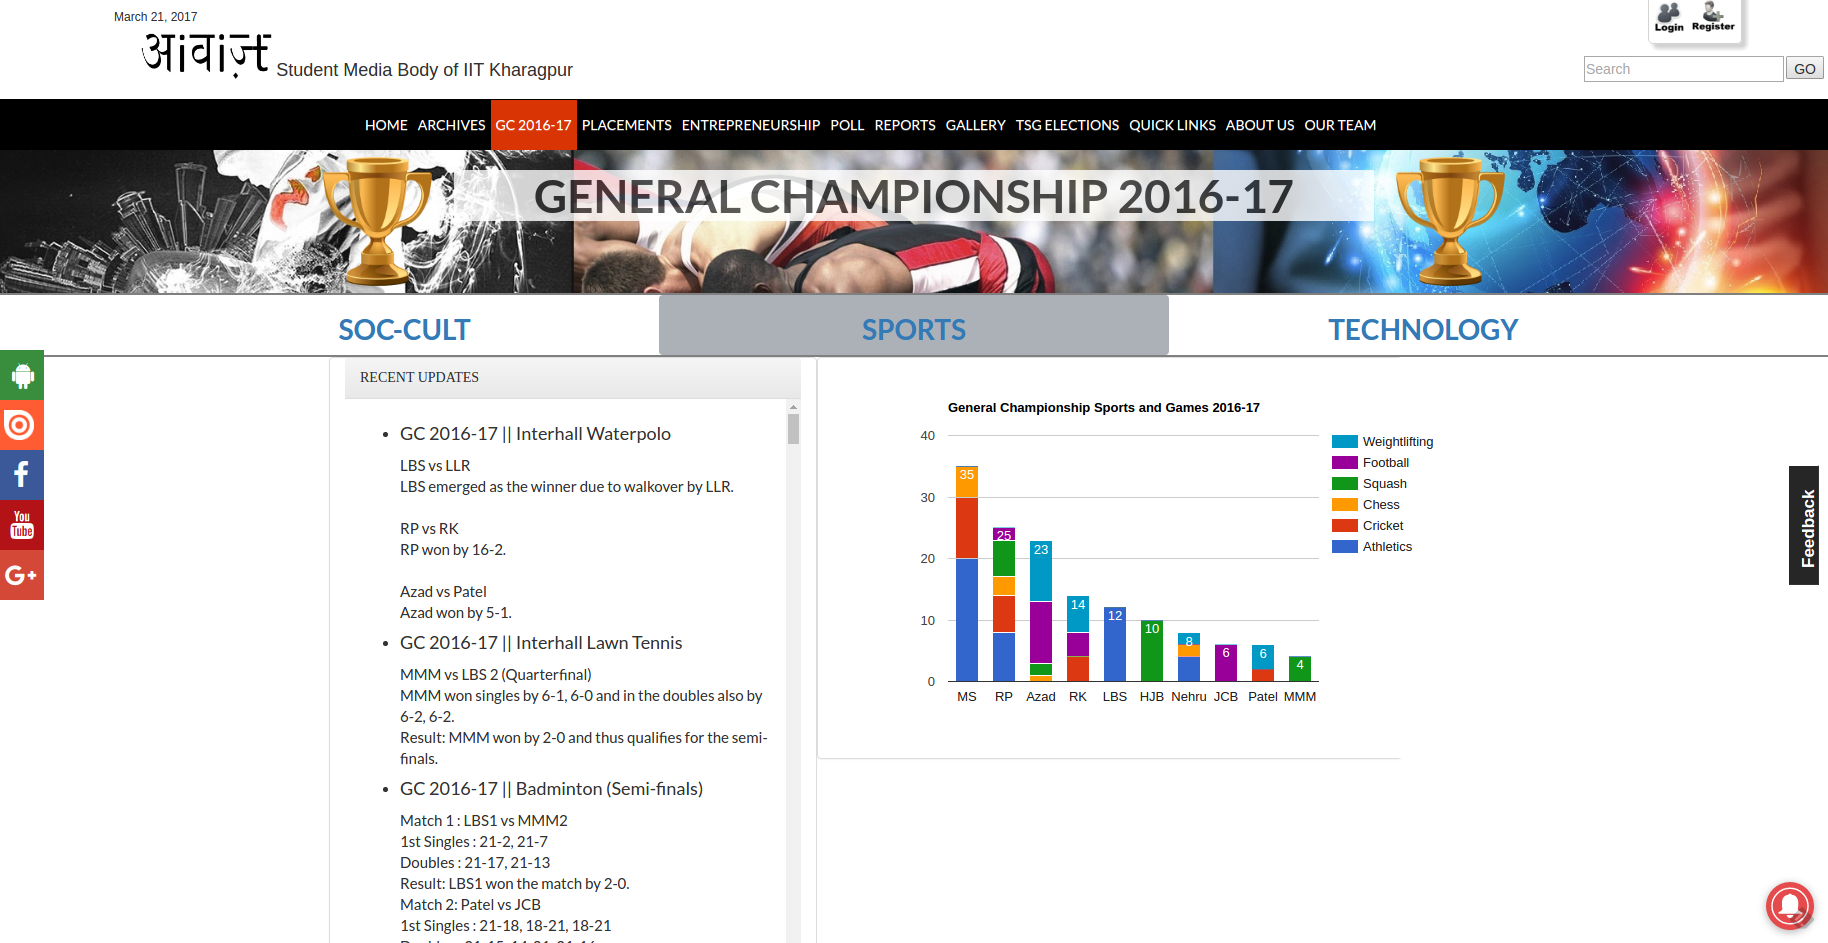
It’s been about 2 minutes since I opened the Awaaz IIT KGP page, and the Google Visualization graph hasn’t yet loaded on Chrome 56 Linux x64. In fact, I think it is never going to load now. There are quite a few errors in the JS console.
Edit: The chart loaded mysteriously when I opened it about 15 minutes after. That’s where the third screenshot above is from.
D3.js is all about speed! It’s an incredibly small library and there are a LOT of tutorials related to every single topic in D3. In fact, the code that I have used in the second stacked bar graph above has been directly copied from a bl.ocks.org created by the author of the linked tutorials. He has a lot of other samples that he has put up on BLOCKS.
D3.js also offers two modes, HTML and SVG. The HTML mode is plain HTML made to look like Graphs! SVGs are of course related to more complex charts, but for the simple bar chart shown in the first screenshot above, I have simply used the HTML bar chart! It’s FAST!
Another logistical improvement for whoever is adding data to the website is that the data is stored in CSV files, which can be directly exported from an existing Excel sheet. Right now, the data is stored inside javascript lists like this one:
    var halls =
    [
      ["hall","Athletics","Cricket","Chess","Squash","Football",
      "Weightlifting","{role: 'annotation'}"],
      ["MS",20,10,5,0,0,0,35],
      ["RP",8,6,3,6,2,0,25],
      ["Azad",0,0,1,2,10,10,23],
      ["RK",0,4,0,0,4,6,14],
      ["LBS",12,0,0,0,0,0,12],
      ["HJB",0,0,0,10,0,0,10],
      ["Nehru",4,0,2,0,0,2,8],
      ["JCB",0,0,0,0,6,0,6],
      ["Patel",0,2,0,0,0,4,6],
      ["MMM",0,0,0,4,0,0,4]
    ];
Whereas a CSV file is far easier to handle. Adding a new event here would require adding a column at the second last place (unless this has been exported from some CSV file using another script, which is TOTALLY possible).
In any case, I have sent the prototypes out to some people. Hopefully, I can get this on the Awaaz Website as an alternative way to view the General Championship scores. This kind of a visualization improvement would make score tracking and following developments very very easy!
This being a prototype, there are definitely improvements that can be made in
this. Most importantly, the colors. Right now, I have just used the six colors
obtained from combinating ff around the 3 places that are available. And then
using it twice. The colors are easily recognizable, but they are still really
bright and that’s probably not the best way to do this. (I wish I would
understand how to pick the right colors!)
Going back to the book, I hope that I can complete reading this book this week. After this, I plan to read a book by Jane Austen (see Day 20: … Jane Austen plans ….
POST #31 is OVER